


We are going through challenging times all around the world. Now more than ever we must rely on the most accurate information, to find opportunities for improvement or change and to avoid as many issues as possible in terms of managing your supply chain.
We understand the importance of having the most relevant market data when making real-time business decisions. We are committed to providing you with the data you need to better control your logistics network. Here you’ll find the latest Transportation and Logistics market insights collected from the most reputable sources, so you can stay informed about market indicators and trends.
This month’s video
Port congestion remains a bottleneck for the supply chain. Further delays are expected in Q2.
Last month congestion has eased in most parts of Asia but continued to escalate in North America. Both west and east American ports have set new highs. Click the video to learn more about why U.S ports are struggling.
Spot Market Insights
According to DAT, the Spot Load Posts decreased last month by 17.5%, compared to January 2022. However, if compared to the same period last year, there was an increase of 17.5% YoY. On the other hand, Spot Truck Posts decreased 1.5% from January to February in 2022 but increased 7% in February 2022 over February 2021.
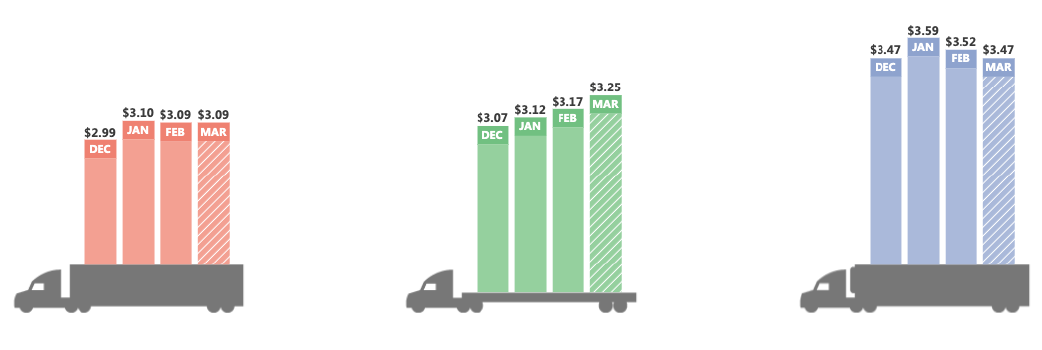
National Spot Rate: Van, Flatbed, Reefer
From: DAT trendlines
The National Load-to-Truck Ratio, which measures the balance between spot market demand and capacity, declined for the second week in a row for dry van and reefer, meaning that capacity should be loosening for these two services.
For flatbed it is the opposite, it has been continuously increasing these last few weeks which is resulting in tighter capacity.
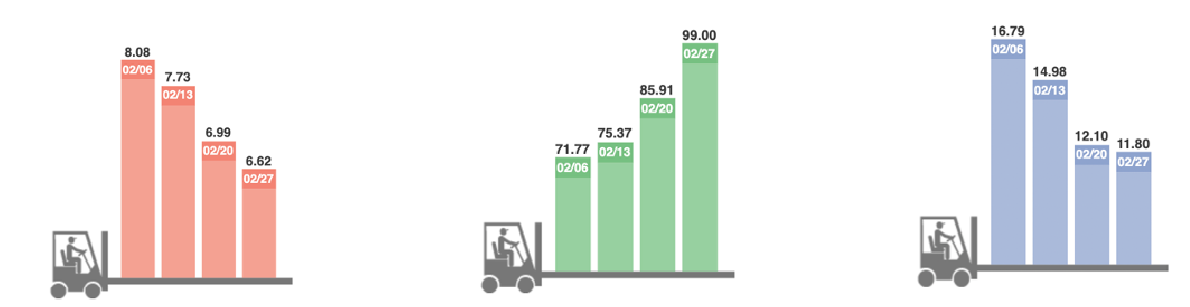
National Load-to-Truck Ratio: Van, Flatbed, Reefer
From: DAT trendlines
Shipping Demand
According to Freightwaves SONAR, the Outbound Tender Volume Index (OTVI), which measures the volume of loads offered by shippers to trucking companies on a given day, has been relatively constant in the past month but is still higher than in January by 2.7 percent. See graphic below.
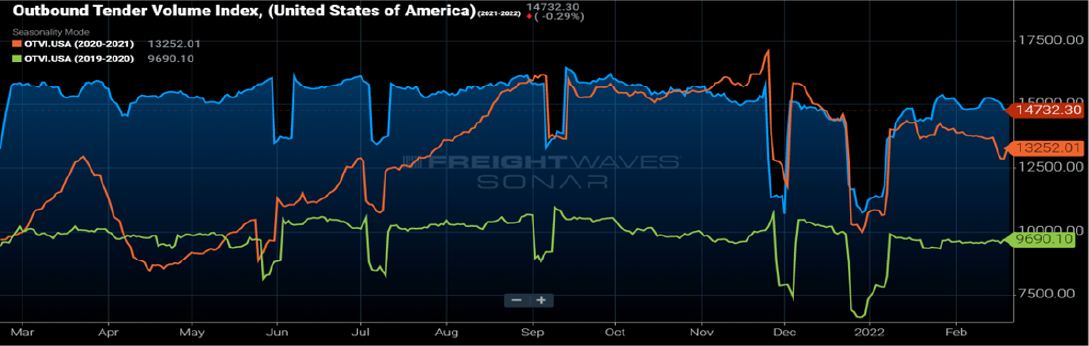
This indicator’s behavior is due to severe climate conditions and surging Covid cases. A minor pullback is expected in spot volumes, assuming stable weather conditions and further declines in Covid case numbers.
Shipping Supply
As seen in the graphic below, the Outbound Tender Rejection Index (OTRI) is defined as the percentage of loads rejected compared to the total loads offered by shippers under contract terms rates.
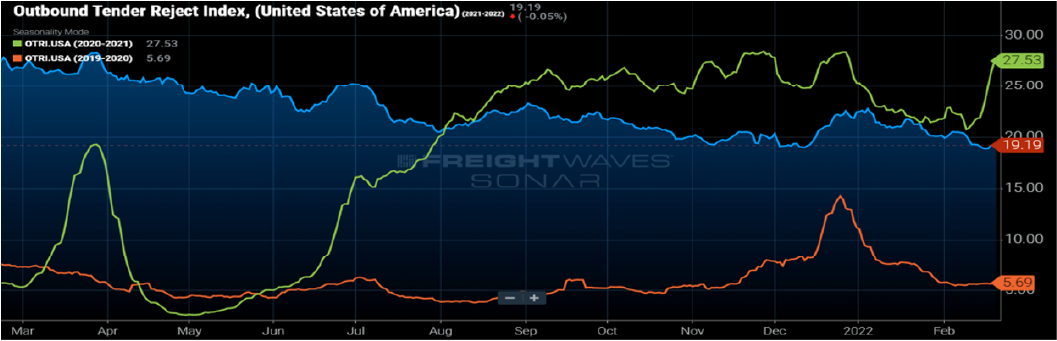
For the first time since July 2020, rejection rates dipped below 19 percent. Despite improvement in the industry, demand remains high. It is a good sign for shippers who are experiencing the usual seasonal trends after a rocky start in 2022.
Check out our new Pick-Up Forecast Tool, which allows shippers to rapidly analyze the performance of top carriers and view what’s going on with pick-ups all around the US.
Driver Shortage
Carriers have been focusing on hiring drivers, especially younger people, and offering better wages, bonuses, and benefits to reduce the labor shortages. This is still a pain point for the industry, but there is an opportunity as well.
Economic Overview
Inflation
According to economic trends, high levels of inflation may last through 2023. U.S inflation is rising faster than any time in 40 years, and it is affecting nearly every sector of the economy.
Various sources such as the pandemic, supply chain factors, labor shortages, and higher demand are some of the many factors driving U.S inflation.
Covid 19
According to senior executives at Moderna, the virus is entering into an endemic phase in some parts of the world. With the Northern hemisphere beginning an era of relative stability, the future seems bright. (https://www.madisonavenuemalls.com/) People could still get sick even if the virus becomes endemic, but they believe that it will follow the same seasonal patterns as other respiratory viruses.
Gasoline Prices
AAA (Gas prices) says that the average price for a gallon of regular fuel across the United States is $3.656, the higher it has been in eight years. This is due to several factors including the situation in Ukraine, the limited growth of crude oil supply, the global shortage of capacity, the boom in demand, and supply chain disruptions, just to mention a few.
We have already seen many disruptions are affecting the logistics industry, but we also see that there is hope. Companies are working hard to overcome these challenges and we are seeing improvements in some sectors. Let’s hope that the good news outweighs the not-so-good ones.
If you would like to go into more detail on this wide topic, we would like to invite you to our next Logistic Sessions where we will bring together thought leaders to explore the market, including the emerging technologies, new strategies, and innovating ideas to thrive and succeed during this challenging time.
Remember GLT is always committed to offering the best service despite all pressures, for all your logistic needs, including FTL, LTL, Drayage, Heavy Haul, Reefer, Expedited & Guarantee shipments.
![]()